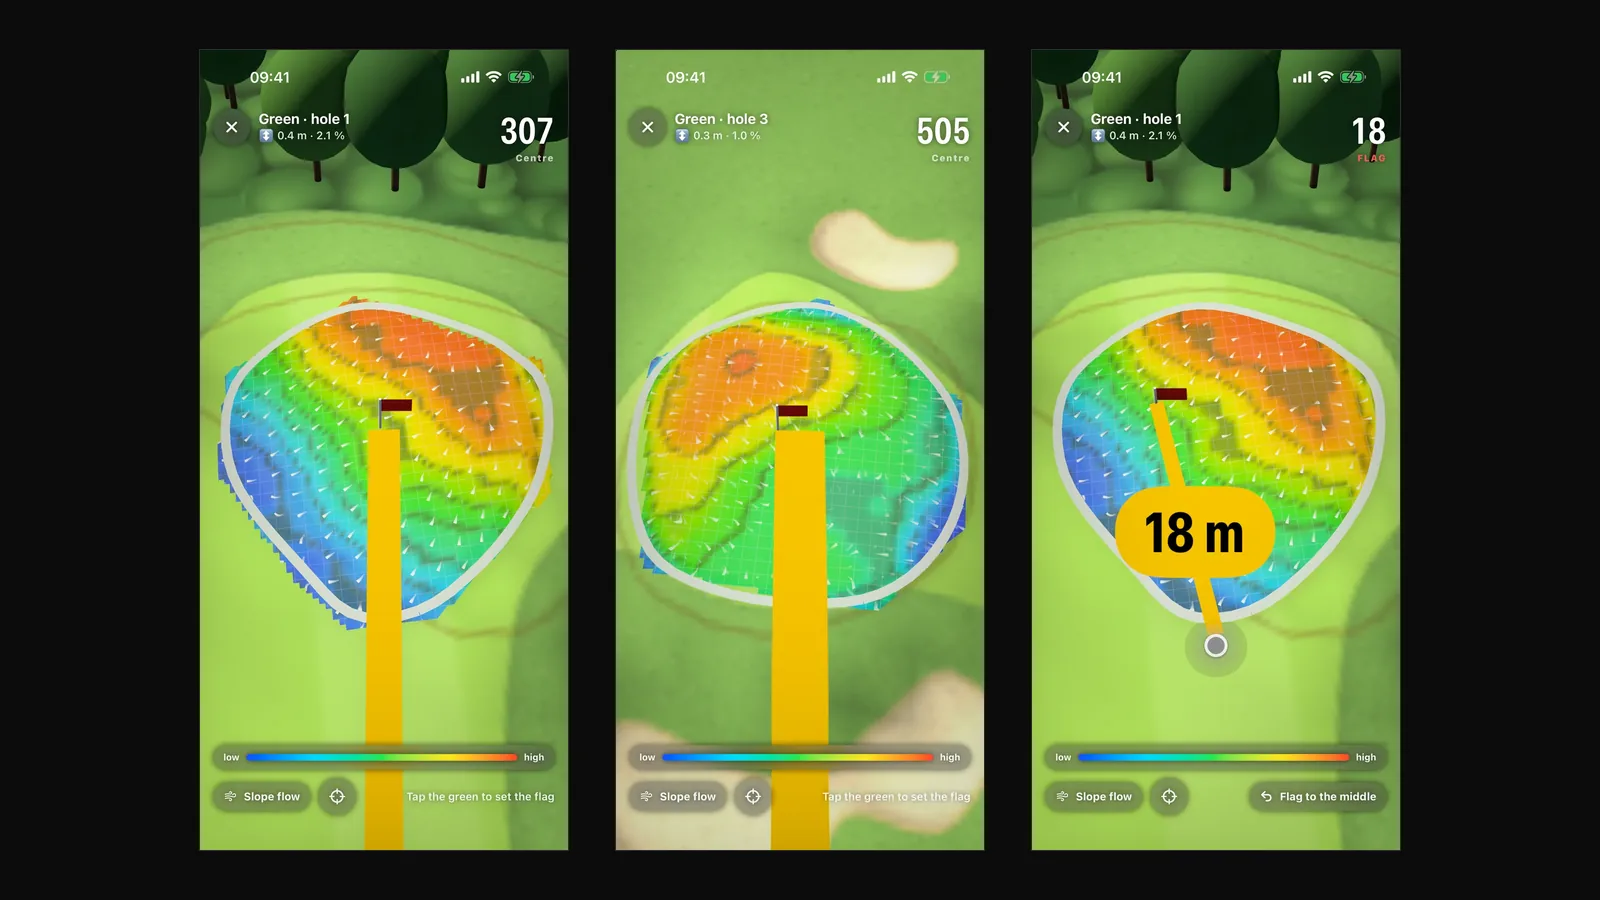
Many putts don't miss because of technique but because the green falls differently than it looks. From the middle of the fairway a green looks flat. Once you're on it, you suddenly see that the flag sits on a crown. A green heatmap shows you that in advance: where the green is high and low, which way it falls and how steeply.
Here is how such a heatmap is built, how to read it and what it can't do.
Where the heights come from
A green is usually only a few hundred square metres, and the height differences on it range from centimetres to just under a metre. Satellite data isn't good enough for that. We use laser-scan terrain models; in Germany, the state survey's DGM1 with a one-metre grid. From it, our course AI computes height and slope for every green on a one-metre grid.
An example: the green on hole 1 at Oberstaufen-Steibis is 268 square metres and 30 metres deep. It has 0.74 metres of height difference, falls 3.5 percent on average and more than 7 percent at its steepest, roughly towards the north.
How to read the heatmap
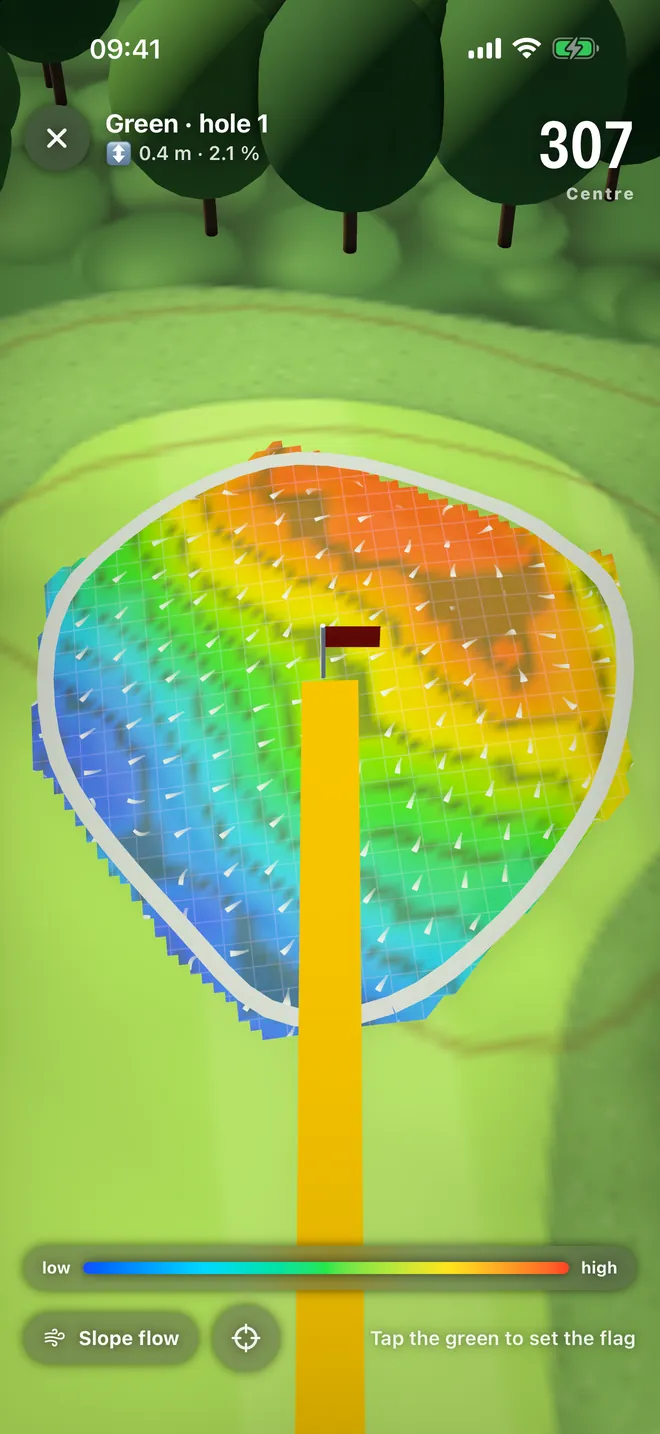
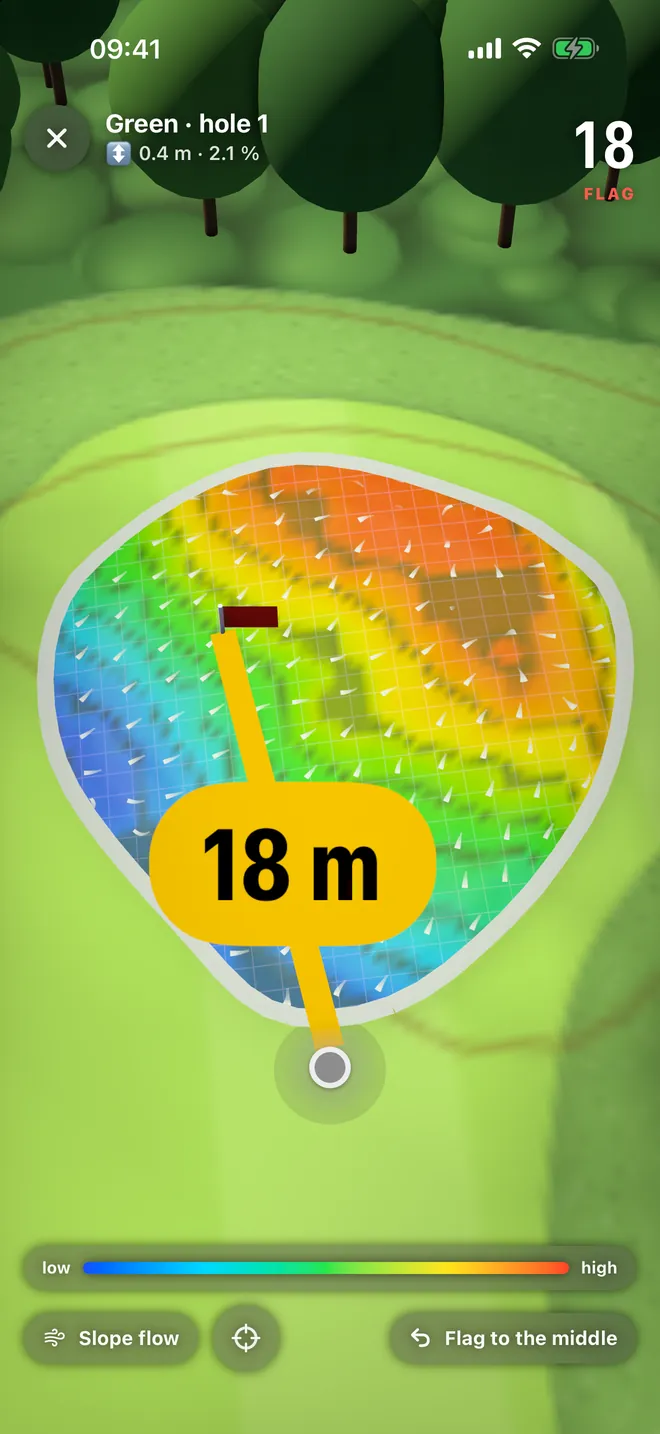
- Colours: blue is low, red is high. The scale at the bottom runs from low to high. Where the colours change quickly, the green is steep.
- Arrows: the slope button shows arrows pointing downhill.
- Key figures: at the top you see the height difference across the whole green and the average slope, for example "0.4 m · 2.1%".
- Set the flag: tap the green where the flag is today. The app shows the distance to the flag and the line to it. A tap resets it to the centre.
From picture to putting line
The heatmap doesn't replace reading on the green, but it tells you what to look for. Three rules help:
- Find the fall line. Through every hole runs a line that goes straight downhill. Putts on that line roll straight. The further your ball sits to the side of it, the more it breaks.
- Uphill is friendlier. Uphill putts can be struck more firmly; the slope slows them. Downhill putts need touch because the ball keeps rolling past the hole.
- The ball breaks most when it slows down. That is, just before the hole. So it pays to look at the slope around the hole more closely than at the middle of the putt.
The heatmap already helps with the approach: if the flag sits just behind a crown, the safe side is often the one from which you putt uphill.
Slope in percent: how much is a lot?
One percent slope means one centimetre of height over one metre. As a rough guide, up to about two percent you hardly feel the slope under your feet but clearly see it in the ball's path. From about three percent pin positions get demanding; beyond that, balls easily roll away from the hole on fast greens. How much a putt actually breaks also depends on green speed, which changes every day with weather and maintenance.
Limits of the heatmap
To be honest: a heatmap is a very good tool, but it isn't magic.
- A one-metre grid shows slopes and crowns, but not small ripples a few centimetres wide.
- Greens change. If a green is rebuilt, the heights are only right again once new laser-scan data is available.
- Speed is missing. The heatmap shows the slope, not how fast the green is today.
On the watch and on the iPhone
The green heatmap is part of the DeepSwing golf course GPS, which is free on iPhone. On Apple Watch you can show the heatmap with slope arrows too. Together with the plays-like distance for the approach, you have the two numbers that matter most on the way to the green.
Frequently asked questions
What does a green heatmap show?
The height of every point on the green as a colour, from low (blue) to high (red), plus arrows pointing downhill if you want them. That way you see crowns, hollows and the fall line before you putt.
How accurate is the green data?
It comes from laser-scan terrain models on a one-metre grid. Against the official original, our heights are within 0.01 metres. Small ripples narrower than a metre are not captured by the grid.
Can I use the heatmap in a tournament?
No: in competition rounds, detailed green maps like this are not allowed under the Rules of Golf. For preparation, practice rounds and casual rounds you can use them.
Does the green heatmap cost extra?
No. It is part of the golf course GPS, which is free on iPhone. For Apple Watch there is a GPS plan at €29.99 a year.
Read greens before you get there: the DeepSwing golf course GPS.